“Don’t try to time the market.” This advice has been passed down often by successful investors like Benjamin Graham, Warren Buffett, Jack Bogle, and Peter Lynch through the decades. But has this mantra held up in recent decades? After all, investors boast access to more and more timely information than ever and they can trade at practically no cost, all while markets have heaved to and fro.
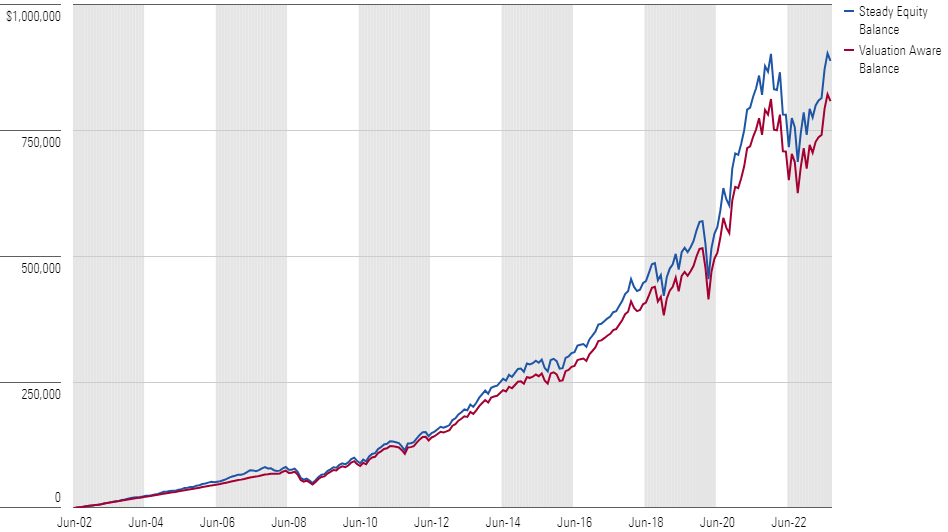
To address that question, we calculated the returns of two portfolios, built up over time through regular income. The first, a Steady Equity approach, puts all income to work in the Morningstar US Market Index. The second, Valuation Aware, invests in the same index when stocks look undervalued but otherwise is willing to hold cash until a more attractive period.
What did we find? In short, while Morningstar equity analysts’ aggregated fair value estimates showed some predictive ability, buying and holding, come what may, still generated better returns over the past 21 years, albeit by a narrow margin of around 0.76% per year.
A Strategy of Steady Equity Investment Outpaces Market Valuation Aware Market Timing Over the Long Term
What held the valuation-aware strategy back? Cash drag. Though the strategy earned higher average returns when the equity screens indicated the market was undervalued, it was more than offset by the upside the strategy missed out on when those same signals showed the market was rich. In other words, because stocks tend to go up over very long periods, it pays to be fully invested, even if occasionally going to cash might have taken some of the edge off at times.
For many, that’s confirmation enough to stick with their buy-and-hold investing strategies. But for those looking for further proof of these conclusions, read on.
The Predictive Power of Aggregated U.S. Fair Value Estimates
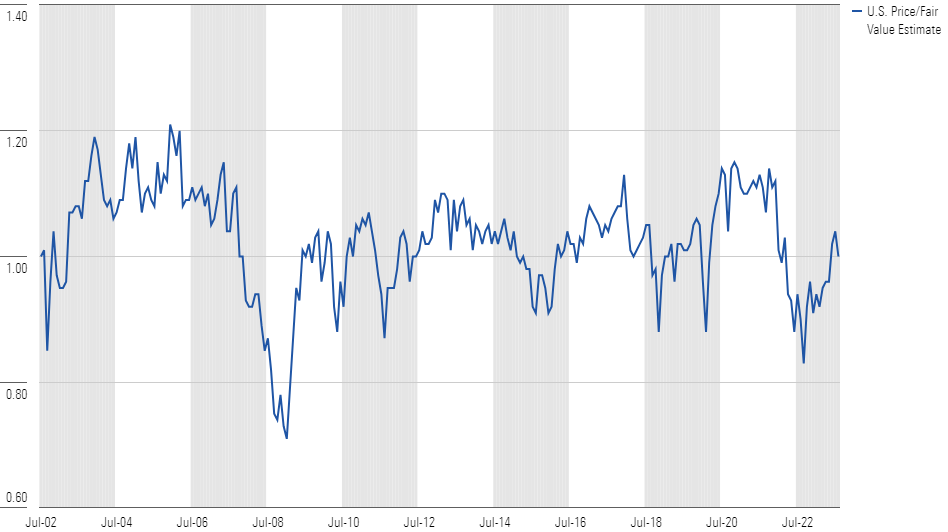
Morningstar equity analysts currently cover nearly 700 stocks listed in the United States. While that number has fluctuated over time, the coverage history goes back to July 2002, and we can use a market-cap-weighted aggregate to determine whether the market was deemed over-, under-, or fairly valued each month. Here’s what that picture looked like. When the blue line sits above 1.00, it indicates the market is overvalued, and the opposite when it sits below that line.
The Aggregate U.S. Price/Fair Value Estimate Ratio Has Oscillated Over Time
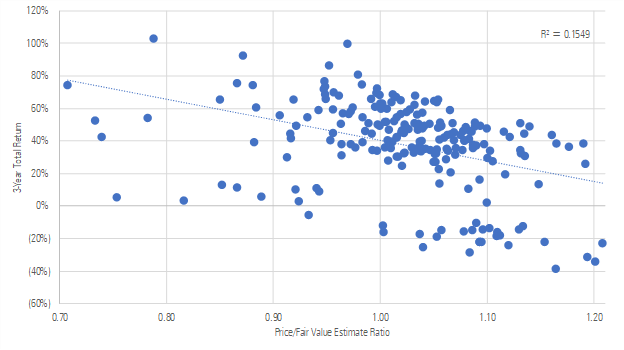
At a high level, it looks like this signal holds some predictive power. For example, when we examined the three years that followed each month over the 20-plus year time period we evaluated, we found the median return of the market was higher when the market was undervalued (that is, aggregate price/fair value estimate ratio > 1.0), and lower and even negative when viewed as overvalued (that is, aggregate price/fair value estimate ratio < 1.0).
Overvalued Markets Have Shown Lower Subsequent 3-Year Returns
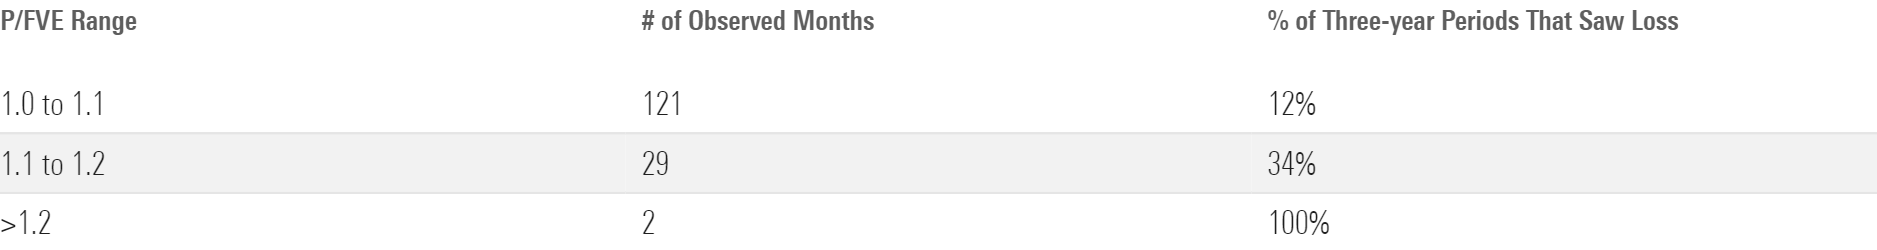
Seen one way, the price/fair value ratio got one key thing very right. Namely, it correctly signaled that undervaluation paved the way to positive future returns. Indeed, there was only one month in this study in which the market looked undervalued (that is, price/fair value ratio < 1.0) and the following three years’ performance was negative: December 2007. Moreover, it correctly foresaw future periods in which returns were likelier to be negative, as shown in the table below.
Periods with Higher P/FVE Ratios Saw a Higher Amount of Negative 3-Year Returns
Building a Market-Timing Model
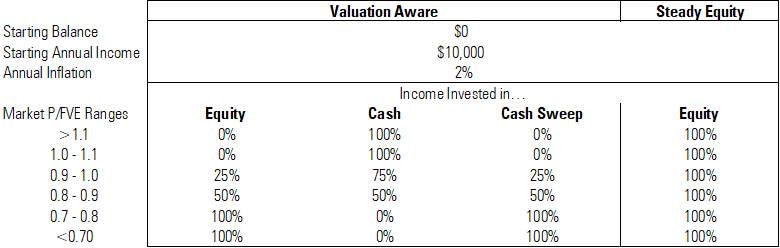
While it was encouraging to find that the price/fair value ratio was directionally correct more often than not, the question was whether that strength could be translated into a successful market-timing strategy. To assess that, we devised a simple “Valuation Aware” strategy that siphoned incoming funds to either equity or cash accounts depending on stock market valuation (that is, the price/fair value ratio) and also “swept” cash into equities when the market looked undervalued (that is, price/fair value ratio < 1.0). We then compared that strategy against a “Steady Equity” benchmark that invests all income in the Morningstar US Market Index no matter the valuation. Neither portfolio sells shares at any point; the allocation to either cash or equities in the valuation-aware strategy affects incremental income only.
Portfolio Rules for Valuation Aware and Steady Equity Portfolios
What did we find? As we already shared above, the Steady Equity strategy outperformed the Valuation Aware strategy, with the original month’s $833 investment growing to $889,000 by the end versus $809,000 for the Valuation Aware approach.
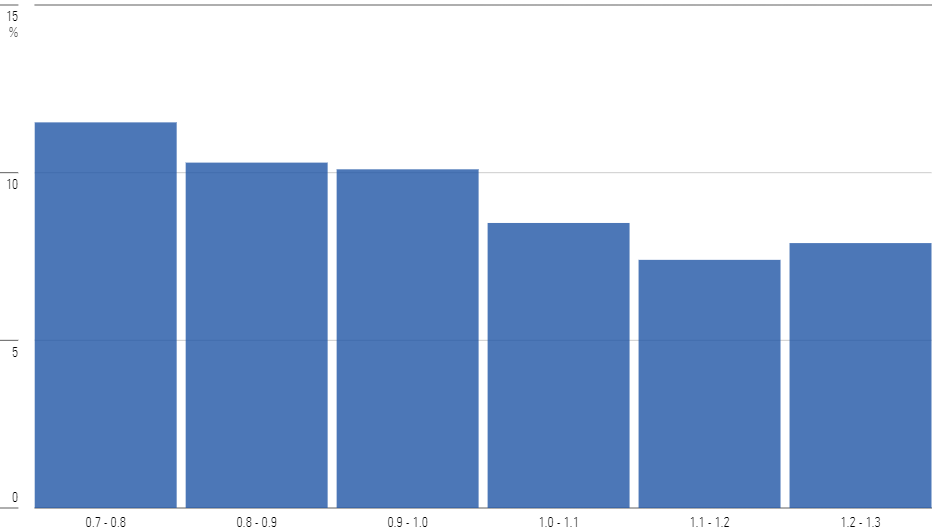
Did it matter when we started the clock? The short answer is no: The Steady Equity strategy’s outperformance was mostly indifferent to when we began the study over the past 21 years, although starting with a market that was overvalued shrank the outperformance margin a bit (about 8% versus 9.9%, on average), as shown in the following chart.
A Steady Equity Investing Strategy Has Outperformed Market-Timing in Most Market Environments
The only starting period in which the Valuation Aware strategy outperformed the Steady Equity investment was between August 2020 and February 2022 (again, measuring performance through August 2023). This is likely partly because our analysts viewed the U.S. market as overvalued at this time, and partly because it’s over a relatively short period that’s comfortably within the three-year window in which the price/fair value ratio has shown some predictive ability.
The Risk/Reward Equation Also Advises Against Market-Timing
Of course, returns are only one consideration in the investment equation. We’d generally expect a portfolio consisting of entirely equities, like the Steady Equity strategy, to exhibit greater volatility than one like the Valuation Aware approach that also moves in and out of cash. Indeed, that’s what we see, with Steady Equity posting a slightly higher standard deviation of annual returns than Valuation Aware, and a slightly higher maximum drawdown (38.8% versus 37.3%).
But this higher risk is, as previously discussed, compensated with higher returns, leading to a higher Sharpe ratio: 0.65, versus 0.56 for the Valuation Aware model. In other words, investors in a Steady Equity strategy have generally been fairly compensated for their higher risk.
Why Doesn’t the Valuation Aware Portfolio Outperform?
Buying shares when they’re undervalued and de-emphasizing them when overpriced may seem like it should outperform a valuation-blind equity investing strategy. However, it appears the Valuation Aware strategy’s underperformance boiled down to mainly two issues.
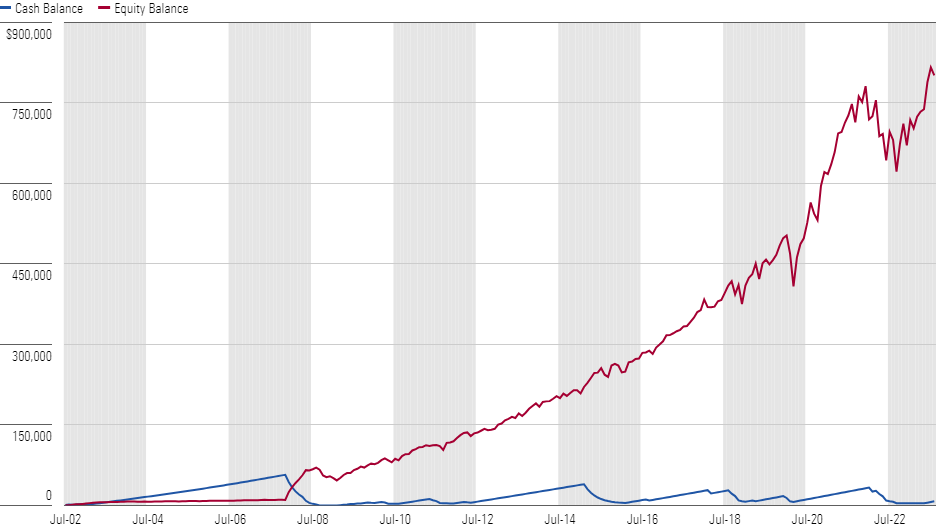
First, while the aggregate U.S. price/fair value estimate signal shows some predictive power when looking at subsequent three-year returns, the stock market has tended to see annual returns over longer periods higher than savings account interest rates, even when the market is slightly overvalued. The Valuation Aware portfolio’s cash balance, particularly early in the study, weighs on results.
The Valuation Aware Portfolio’s Cash Balance is Substantial Early in the Study
Second, while extreme market over- or undervaluation has led to sharp under- or outperformance, these situations are exceedingly rare. In the vast majority (79%) of months over the past 21 years, the market has been within 10% of fair value. A Valuation Aware strategy simply didn’t have enough opportunities to make up lost ground versus a Steady Equity portfolio that was able to strongly compound capital in nearly all market environments.
To sum up, it’s probably not worth spending a lot of time trying to time the market. While it may be worth sitting on the sidelines when the market looks egregiously overvalued, as it stands now Morningstar’s equity analysts view the U.S. market as roughly 11% undervalued. And there are always undervalued stocks to consider for those looking for individual company securities.
Source: Adam Fleck, Morningstar, 8 November 2023.
How we help
We can help take the effort out of this for you by demonstrating how this would work for you and your family and providing you with one cohesive Holistic Lifestyle Financial Plan.
You can arrange a meeting by clicking here to access my diary, email info@smartfinance.ie or call 087 8144 104.